Visual Articulation Goal Tracker TEMPLATE
I knew intellectually that data guides treatment, but mine wasn't doing enough for me.
What to do? I needed a way to enter in session data that would automatically calculate trends of interest, help me visualize patterns, and be easily shareable at a meeting or in progress notes. TaDa! Enter Excell with the help of function buttons, "Sparklines", and charts. Now I enter data once like I normally do, but a whole lotta magic happens.
Here's a guide through my first attempt for an articulation data template:
1. Easily show client level of traditional articulation therapy.
2. Automatically calculate percentages from the day's trials.
What to do? I needed a way to enter in session data that would automatically calculate trends of interest, help me visualize patterns, and be easily shareable at a meeting or in progress notes. TaDa! Enter Excell with the help of function buttons, "Sparklines", and charts. Now I enter data once like I normally do, but a whole lotta magic happens.
Here's a guide through my first attempt for an articulation data template:
1. Easily show client level of traditional articulation therapy.
- I color coded each level to easily show if the client was working on the target in syllable, word, phrase, sentence, conversation, or carryover level.
2. Automatically calculate percentages from the day's trials.
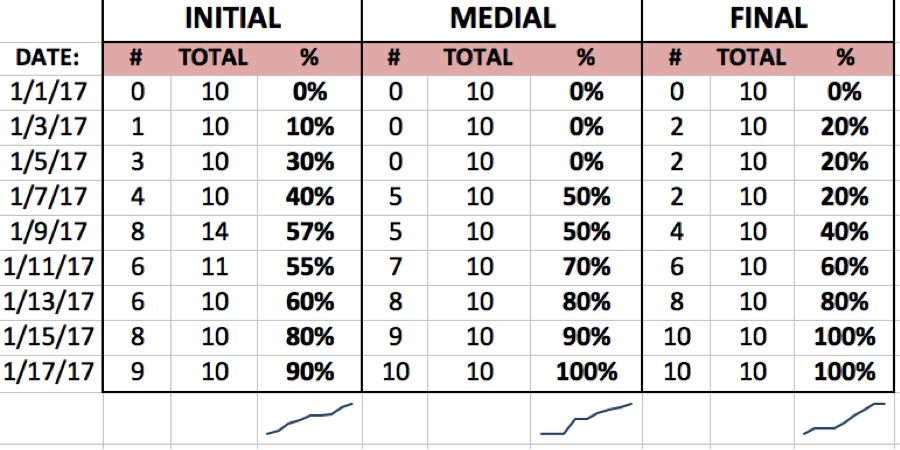
- Make three columns, one for the date, one for #correct, one for #trials, and use the function button to tally percentages (EXAMPLE: =CELL#CORRECT/CELL#)
3. Differentiate initial/medial/final position.
- If a target sound needs work in all 3 positions of a word, they may progress at different rates.
- Each position (IMF) gets it's own tiny area on the same row.
I added Sparkines, or tiny 1 cell charts to quickly show each positions progress.
4. Visually show data
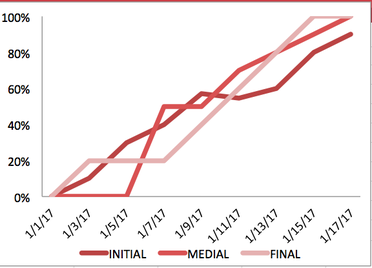
- Each % row automatically generates a visual graph of progress for each level. Initial, medial, and final each have their own line, so it's easy to see degree of progress over time.
CELEBRATE THE DATA! Your client worked hard for those numbers!

